Return on Assets Calculator (ROA)
Want to gauge your company's asset performance? Our free Return on Assets Calculator reveals how effectively your assets generate profits. Perfect for CFOs, investors, and analysts. Just input net income and total assets—get your ROA ratio instantly.
Share Calculator


Business Calculators | |
Table of Contents
What is Return On Assets (ROA)?
Return on Assets (ROA) mean?
Accounting ratios can be used to measure performance by any company. There are many types of accounting ratios, and the beneficial ratio is one of them. The beneficial ratio is how much profitability a company has or how profitable any company is. Profitability implies the capability of the company to earn profit or is capable of making profits.
It is a profitability ratio known as return on assets (ROA). ROA is the return on assets, as it's called. We know how many types of assets are used in any company, so any company is using several assets in its business, i.e., the purpose of these assets is they are using to generate income from these assets, then we get to know this thing from ROA. Given that ROA is the ratio of the profit earned from assets used by the company, it is viewed better the higher the ROA, even if the assets were not used properly, or how well they were used to generate income. The better we use the assets to earn income, the higher the ROA.
The formula of ROA is. ROA = Net Income / Average Total Assets. That means the net income equals the total assets, and so the value of what we have invested in the business, in terms of assets, is equal to the value of the income we have earned. Then we know if it's more than 1, it's good. This is to say that we've made more dollars in income than the assets we've put into (it's the other way around). For example, if the ROA here is 1.5, we have earned $1.5 for every $1 of assets invested in the business. If it is less than 1 (such as 0.5 or 0.1), it is not so good. This means we have invested $1, but in terms of that, we are earning 0.5 or 0.1. This is actually about (ROA) Return on Assets.
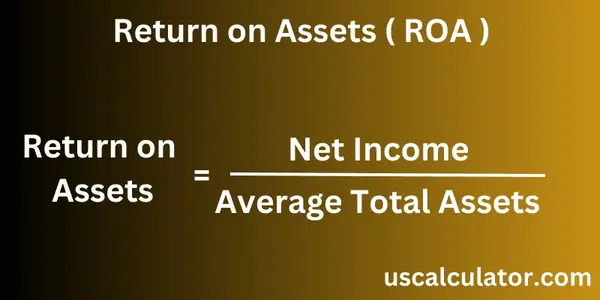
Return on Assets Calculation Formula
correct the calculation example for the Return on Assets (ROA) ratio.
The correct formula for Return on Assets is:
| ROA% = ( |
| ) × 100 |
| ROA = |
|
1.Understand Company Financial Information:
Total Assets at the end of the year: $ 3,000,000
Total Assets at the beginning of the year: $ 1,000,000
Net Income: $ 500,000
2 . Calculate Average Total Assets:
| Average Total Assets = |
|
| Average Total Assets = |
| = $2,000,000 |
3. Add in the Numbers into the Formula:
| ROA = |
|
| ROA = |
|
4. Perform the Calculation:
ROA = 0.25
5. Explanation of the Result:
The ROA ratio is 0.25 or 25%.
Return on Assets % Calculation Formula
| ROA% = ( |
| ) × 100 |
Net Income = Profit after all expenses and taxes (from the income statement).
| Average Total Assets = |
|
Example Calculation
Company XYZ Financials (2023):
Net Income: $500,000
Beginning Total Assets (Jan 1, 2023): $4,000,000
Ending Total Assets (Dec 31, 2023): $6,000,000
Step 1: Calculate Average Total Assets
| Average Total Assets = |
| = $5,000,000 |
Step 2: Compute ROA
| ROA = |
| × 100 = 10% |
Company generated a 10% return on its assets in 2023, meaning it earned $0.10 for every $1 of assets.
What Is a Good Return on Assets?
There's no one-size-fits-all answer here. A strong ROA means different things depending on the industry, how much physical stuff a business needs, and even the company's size.
If you look at asset-light companies—think software firms, consulting services, or online retailers—they usually post higher ROA numbers. That's because they don't need a ton of expensive equipment or property to make money. On the other hand, businesses like utilities, manufacturers, airlines, and banks are a different story. These companies pour a lot of money into buildings, machines, or even loans, so their ROA tends to look lower.
The smartest way to judge an ROA is by comparing it to something meaningful. Check how the company's ROA stacks up against its own numbers from past years. Compare it to the industry average, or line it up against direct competitors who run similar businesses at a similar scale.
If ROA is rising year after year, that usually points to better efficiency. If it's falling, that can hint at assets not pulling their weight, costs going up, or tough competition.
The following table offers general interpretive ranges for illustration only. Some resources offer rough ranges for what “good” ROA looks like, but those are just ballpark figures. Don't treat them as hard rules—they're no substitute for digging into the specifics of the industry you're looking at.
| ROA Range | General Interpretation (Illustrative) |
|---|---|
| Below 5% | Often considered low; may signal inefficient asset use or heavy capital intensity |
| 5% - 10% | Moderate; common in many capital-intensive industries |
| 10% - 20% | Solid performance for many businesses |
| Above 20% | Strong; more typical of asset-light or high-margin models |
Always interpret ROA in context rather than treating any percentage as inherently good or bad.
Frequently Asked Questions About Return on Assets
1. What makes a “good” ROA?
It's all about context. A strong ROA means the company's doing better than its usual numbers and outpacing most of its industry peers. But asset needs vary a lot between industries—a tech company pulling 25% isn't really in the same league as a utility with 4%, so don't bother comparing apples to oranges. Look at competitors and past years to get a real sense of performance.
2. What's the difference between ROA and ROE?
Now, ROA and ROE sound similar, but they measure different things. ROA tells you how well a company uses everything it owns (including what it borrows) to make money. ROE, on the other hand, zooms in on how well it rewards its shareholders.
Here's the breakdown:
ROA = (Net Income ÷ Average Total Assets) × 100
ROE = (Net Income ÷ Average Shareholders' Equity) × 100
So, ROA is about squeezing the most out of every dollar invested in assets, while ROE is about maximizing returns for the company's owners. Leverage gives ROE a boost—but that's another story.
| Metric | Focus | Formul | Key Insight |
|---|---|---|---|
| ROA | Total assets | Net Income ÷ Average Total Assets × 100 | ROverall asset efficiency |
| ROE | Shareholders' equity | Net Income ÷ Average Equity × 100 | Return to owners; affected by leverage |
| ROI | Specific investment | (Gain - Cost) ÷ Cost × 100 | Return on a particular project or asset |
3. Why do banks have such low ROA but often strong ROE?
Banks usually post a low return on assets (ROA) but a much stronger return on equity (ROE), and it all comes down to leverage. They work with massive amounts of assets—think loans, investments, and cash. Even when a bank turns a decent profit, dividing it by such a huge asset base produces a small ROA. But the real story shows up in ROE. Banks typically use a lot of leverage, so they hold relatively little equity compared to their assets. That same net income, when compared to the smaller equity slice, turns into a much bigger ROE.
For example, if a bank earns $10 million and has $1 billion in average assets, ROA is just 1%. But if average equity is only $80 million, ROE jumps to 12.5%. The huge balance sheet pulls down ROA, while the leverage gives ROE a boost.
4. Should I use total assets at year-end or the average for the period?
When it comes to calculating ROA, always go for the average total assets over the year. It gives a clearer picture of the resources in play, avoiding weird distortions from one-off events like a big asset sale or a seasonal spike right at year-end. Only rely on year-end assets if you have no other choice, and if you do, be sure to mention it's more of an estimate.
5. How is ROA different from ROI?
ROA measures how well a company uses all its assets to turn a profit. ROI, on the other hand, focuses on the return from one particular investment—like a single project, a new product, or a specific purchase.
So, ROA gives you a sense of how efficiently the whole business is running. ROI just tells you if one specific choice paid off.
You might see a company with a healthy ROA overall, but when you dig into individual projects, the ROI numbers can be all over the place—some strong, others not so much.
6. Can ROA be negative, and what does that mean?
Yes, ROA can go negative if the company's losing money—basically, if net income drops below zero.
For example, say a business has a net loss of $30,000 and average total assets of $250,000. The math would look like this:
ROA = (-$30,000 ÷ $250,000) × 100 = -12%
A negative ROA means the company isn't covering its costs. It's actually destroying value instead of creating it with its assets. If this keeps happening, it's a sign the business needs to take a hard look at its expenses, pricing, or how it's using what it owns.