Free Productivity Calculator
Want to maximize your time and output? Our free Productivity Calculator helps you measure efficiency, set benchmarks, and optimize workflows. Track progress, eliminate wasted hours, and work smarter.
Share Calculator


Business Calculators | |
Table of Contents
About the Productivity
What is productivity, and how do we measure it? The ratio of the output to the input used in a production process is a measure of productivity. What it means is that when there is any production in a company, we make use of some input such as land, labor, capital, machinery, or any material, and by making all these inputs, some result or output is obtained. Therefore, what is the ratio of the output coming in and our input? It is productivity. We mathematically denote it as this. P = O/I. "P" is productivity, "O" is output, and "I" means input. Denote it like this:
Productivity Measurement
How do we measure productivity? A productivity measure is the ratio of output to input used in a production process. It means that whenever there is any production in a company, we use some input or another in it, like land, labor, capital, machinery, or material, and by using all these inputs, we generate output. So, what is the ratio of the output that came and the input we used? It is productivity. Mathematically, we denote it like this. P = O/I. "P" is productivity, "O" is output, and "I" means input. Denote it like this:
Productivity is measured in different ways. There are four types of productivity measurement.
1. Single-factor productivity measurement: This is all about a single factor; it simply means looking at the productivity of a single input. And it can be the laborer; they say it is labor productivity, or it can be the machine, so it's machine productivity, or it can be the material, so it's material productivity.
2. Multi-factor productivity measurement: Here, the productivity of multiple factors is calculated.
3. Total (composite) factor productivity: Here, we calculate the product of any two factors.
4. Total productivity model: where the total input is the ratio of whatever is done to it to the total output. So there is the total productivity model.
Here, to effectively calculate productivity, our calculator employs a simple but practical formula:
Productivity = Output / Input
For example, if you completed 10. tasks (output) in 20 hours of work (input), your productivity would be calculated as follows:
Productivity = 10 tasks / 20 hours = 0.5 tasks per hour.
numerical representation allows you to compare and track production over time, which helps improve performance and create targets. The Productivity Calculator is your favorite tool for maximizing productivity and setting fresh standards for individual and team activities.
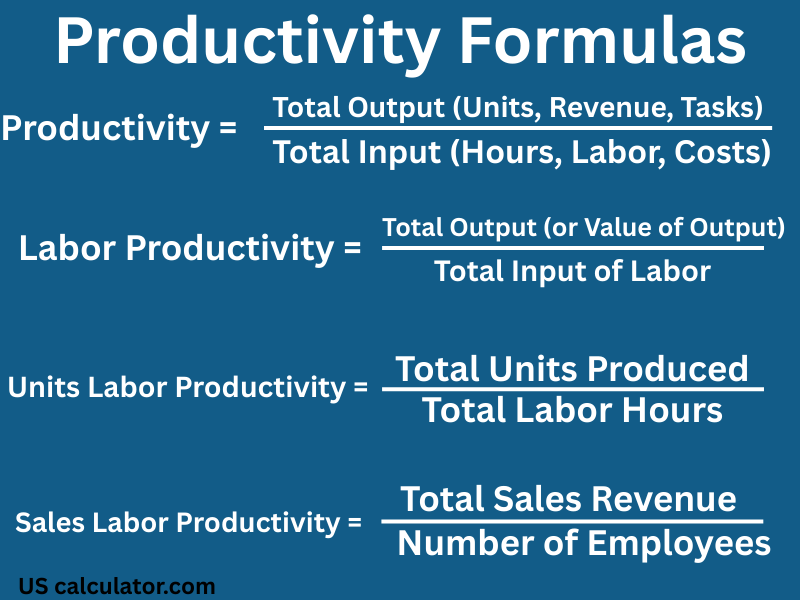
Productivity Calculation Formula and Example
Here, to effectively calculate productivity, our calculator employs a simple but practical formula:
| Productivity = |
|
| Productivity Rate (%): = ( |
| ) × 100 |
| Revenue per Employee: = |
|
| Therapist / Billable Utilization (%): = |
| × 100 |
Example 1. if you completed 10. tasks (output) in 20 hours of work (input), your productivity would be calculated as follows:
| Productivity = |
| = 0.5 tasks per hour. |
Example: 2.
A design team completes:
Output: 120 projects in a month
Input: 480 labor hours worked
| Productivity = |
| = 0.25 projects/hour |
Interpretation: The team delivers 0.25 projects per hour.
Multifactor Productivity
Multifactor productivity measures output relative to multiple inputs (labor, materials, energy, etc.).
Multifactor Productivity = Total Output / (Labor + Materials + Energy + Capital)
Example:
A company produces $500,000 worth of goods. The costs are: Labor = $100,000, Materials = $75,000, Energy = $25,000.
Multifactor Productivity = $500,000 / ($100,000 + $75,000 + $25,000) = 2.5
Machine Productivity
Measures the output generated by machines relative to the time they operate.
Machine Productivity = Total Output / Machine Hours
Example:
A CNC machine produces 2,500 parts in 80 hours of operation.
Machine Productivity = 2,500 parts / 80 hours = 31.25 parts per hour
Energy Productivity
Measures the output generated per unit of energy consumed.
Energy Productivity = Total Output / Energy Consumed
Example:
A manufacturing plant produces 50,000 units while consuming 100,000 kWh of electricity.
Energy Productivity = 50,000 units / 100,000 kWh = 0.5 units per kWh
Overall Equipment Effectiveness (OEE)
OEE measures how effectively a manufacturing operation is utilized compared to its full potential.
OEE = Availability × Performance × Quality
Example:
A machine has:
Availability = 90% (it's available 90% of the planned production time)
Performance = 95% (it runs at 95% of its maximum speed)
Quality = 98% (98% of products meet quality standards)
OEE = 0.90 × 0.95 × 0.98 = 0.8379 or 83.79%
How to calculate labor productivity?
We have given below three basic formulas for calculating labor productivity.
| Labor Productivity = |
|
| Units Productivity = |
|
| Sales Productivity = |
|
For reliable comparison, it is important to utilize consistent units for both input and output.
Productivity Calculator Questions and Answers
1. What's a productivity calculator?
Think of a productivity calculator as a quick way to see how much you're actually getting done compared to the time or energy you've put in. It uses a simple formula—output divided by input—and spits out a number that tells you how efficient you are. For individuals, it's handy for checking personal progress. For businesses, it helps set goals, spot trends, or figure out where people's time really pays off. Instead of just feeling busy, you get a clear, measurable score you can try to improve.
2. How do you figure out your productivity?
The formula's pretty straightforward:
Productivity = Total Output ÷ Total Input
Your output could be reports finished, products made, words written, or money earned. Input's usually just hours worked or resources spent.
Say you complete 12 client reports in 8 hours:
Productivity = 12 ÷ 8 = 1.5 reports per hour
If your productivity number goes up, you're getting more done for every hour you work. Just make sure you're always tracking the same thing each time—otherwise, the comparison doesn't mean much.
3. What's a good productivity score?
Honestly, there's no single answer. What's considered “good” really depends on the type of work you're doing, the industry, the tools you have, your goals, and how you measure things. Say a factory worker cranks out 20 units an hour—that might be impressive in one place. Meanwhile, someone in a data role might only finish three complex analyses in a day, which could be strong in that line of work. The real comparison is your own numbers versus your past performance or a realistic goal for your role and time frame. Don't worry about some generic ideal—focus on what makes sense for you.
4. Is productivity score the same as productivity rate?
| Aspect | Productivity Score | Productivity Rate |
|---|---|---|
| Meaning | MOften a normalized or percentage value reflecting overall performance | Output produced per unit of input (or against a standard) |
| Calculation | CalculationVaries by tool; may weight multiple factors or convert a rate to a 0-100 scale | Output ÷ Input (or Actual ÷ Standard × 100) |
| Purpose | Quick snapshot for ranking or dashboards | Precise comparison of efficiency over time |
| Example | 78/100 based on tasks and focus time | 1.5 reports per hour or 85% of target rate |
They are related but not identical. A rate is the raw calculation; a score is frequently a derived or scaled version of that rate.
5. What's the productivity rate?
The productivity rate tells you how much you get done for the resources you use—or how you stack up against a set standard in a specific time period.
Here's the formula: Productivity Rate = Total Output ÷ Total Input
You can also compare it to a target, like this: Actual Output ÷ Standard Output × 100.
For example, let's say an agent solves 45 tickets in a 9-hour shift. That's 45 ÷ 9, so 5 tickets per hour. If the team's standard is 4 tickets per hour, the comparison would be (45 ÷ 36) × 100, which comes to about 125%. That means the agent went above and beyond the standard.
6. Does this tool save my data?
Online calculators usually crunch the numbers right in your browser for your convenience. Still, it's smart to check the website's privacy policy so you know what happens to anything you type in. The policy spells out if they collect cookies, track your usage, or save your inputs. Don't just guess—reading the policy tells you exactly how your data's handled.
7. Can I use this calculator for studying?
Absolutely. Students can use this tool to measure their progress—like tracking finished study blocks, chapters, problem sets, or how many flashcards they review. For example, say you finish 6 sets of practice problems in 4 focused hours. Your productivity is 6 divided by 4, so 1.5 sets per hour. Keep track of this info over time and you'll see if tweaks to your schedule or methods actually help. It's a great way to set practical goals for each day.
8. Can I use this calculator for remote work?
Absolutely. If you're working remotely—whether you're a freelancer, employee, or you just work from home—you can plug in your finished tasks, deliverables, or anything you bill for as your output, and enter your logged work hours as input. That way, you see your real output per hour, spot when you're actually productive versus just keeping busy, and set goals that make sense for your daily or weekly workflow. You don't have to just track what hours you sit at your desk.
9. How does WebWork measure productivity?
WebWork is all about tracking time and managing work. It keeps tabs on the hours you log, checks your activity with keyboard, mouse, and scrolling signals—basically, how much you're interacting with your computer—and breaks it down per minute. It also tracks which programs and websites you use, snaps optional screenshots, and pulls everything into productivity reports. You can tag apps and websites as productive, neutral, or a distraction, so you see exactly how your tracked time splits up. The “activity level” shows how engaged you are on your computer, but that's not the same thing as actual results. Real productivity still comes down to what you finish—your tasks, deliverables, or whatever moves the business forward. WebWork's reports blend your time and activity data with your real outcomes, and you get to control what gets monitored.
10. What is the labor productivity formula?
Labor productivity shows how much each worker gets done. You figure it out by dividing total output by total labor hours:
Labor Productivity = Total Output ÷ Total Labor Hours
You can also measure by employee—just take total output and divide by the number of employees:
Labor Productivity per Employee = Total Output ÷ Number of Employees
Here's an example: Let's say a workshop makes 2,400 units in one month. Employees put in 600 labor hours and there are 10 people on the team.
Labor productivity = 2,400 ÷ 600 = 4 units per hour
Per employee = 2,400 ÷ 10 = 240 units per person
Always use the same time periods and units if you want to compare results.
11. How do I calculate employee productivity or revenue per employee?
Now, if you want to measure employee productivity, you can use tasks completed, units produced, or revenue. The main formulas are similar:
Employee Productivity = Total Output ÷ Total Labor Hours (or Number of Employees)
Revenue per Employee = Total Revenue ÷ Number of Employees
Take this scenario: A service company makes $480,000 in a quarter. They have 12 employees who together work 5,760 hours.
Revenue per employee = $480,000 ÷ 12 = $40,000
You can also break it down per hour or per project, depending on what matters to your business. But revenue per employee is just one piece of the puzzle. If you really want to know how productive your team is, look beyond the numbers—quality, complexity, teamwork, and long-term goals matter just as much.
12. How do I calculate the percentage change in productivity?
If you want to figure out the percentage change in productivity, here's how you do it: Take your new productivity rate, subtract the old rate, then divide by the old rate. Finally, multiply by 100 to get your percentage.
For instance, say you used to produce 4 units an hour, and now you're at 5. The calculation goes like this: (5 - 4) ÷ 4 × 100 = 25%. That's a 25% boost.
Now, if your old rate was 1.5 reports per hour and you're down to 1.2, the math is: (1.2 - 1.5) ÷ 1.5 × 100 = -20%. That means productivity dropped by 20%.
If the result is positive, you improved. If it's negative, things slipped. Just make sure you're comparing rates—like output per hour—not just total output, so you get a true picture.
13. What is the difference between productivity and efficiency?
| Aspect | Productivity | Efficiency |
|---|---|---|
| Definition | Output produced relative to input used | How well resources are used with minimal waste |
| Main focus | How much is produced | How little is wasted to produce it |
| Measurement | Output ÷ Input | Useful output ÷ Total input (or waste reduction) |
| Example | 10 tasks in 8 hours = 1.25 tasks/hour | Completing those 10 tasks with only 6 hours of pure focus time |
| Business application | Tracking volume and throughput | Reducing idle time, rework, and excess resource use |
Productivity asks “how much came out?” Efficiency asks “how little went to waste?” Both are valuable; a team can raise productivity by working longer hours while becoming less efficient.
14. What does the what-if slider show?
A what-if slider lets you play around with potential productivity improvements. You slide it to test a percentage increase—say, 10%—and right away, you see how that would boost your output with the same hours, or how many hours you could save by working more efficiently. For example, if you're doing 5 units an hour and bump that up by 10%, you'd see 5.5 units every hour. Or, the tool shows you how long it'd take to hit your original target with this new speed. It's a quick way to get a feel for how small changes in productivity could make a real difference, all without messing with your original numbers.
15. Should I use hours or days as the input?
When choosing between hours or days as your input, hours are usually better if you've tracked time closely. They give a much clearer view, especially for part-time gigs, overtime, or quick tasks. Days work when you want a big-picture summary (like weekly or monthly productivity), but they can miss the details.
Students often track their study hours because it keeps them focused. Employees and freelancers use hours to keep tabs on billable work. Companies sometimes convert hours into days to make things consistent across teams.
Stick with the same time unit when comparing periods. That way, your results mean something.